Book a Demo!
CoCalc Logo Icon
StoreFeaturesDocsShareSupportNewsAboutPoliciesSign UpSign In
Download

📚 The CoCalc Library - books, templates and other resources

132928 views
License: OTHER
Kernel: Python 3

Using statsmodels lowess

Copyright 2019 Allen B. Downey

MIT License: https://opensource.org/licenses/MIT

%matplotlib inline import numpy as np import pandas as pd import random import matplotlib.pyplot as plt

This article suggests that a smooth curve is a better way to show noisy polling data over time.

Here's their before and after:

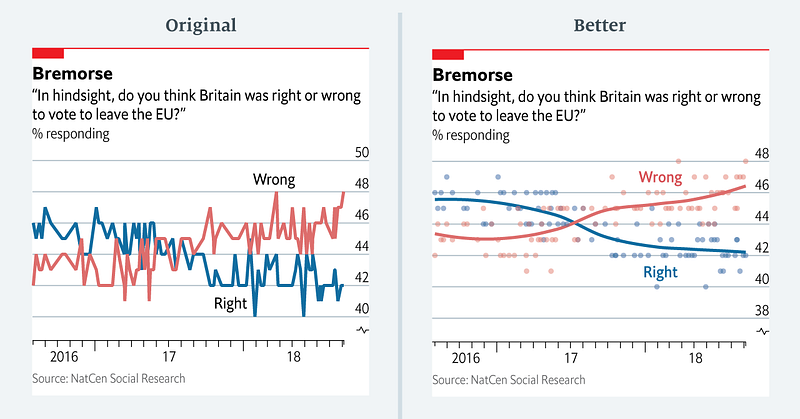
And here's their data:

df = pd.read_csv('Economist_brexit.csv', header=3, parse_dates=[0]) df.index = df['Date'] df.head()
df.tail()

The following function uses StatsModels to put a smooth curve through a time series (and stuff the results back into a Pandas Series)

from statsmodels.nonparametric.smoothers_lowess import lowess def make_lowess(series): endog = series.values exog = series.index.values smooth = lowess(endog, exog) index, data = np.transpose(smooth) return pd.Series(data, index=pd.to_datetime(index))

Here's what the graph looks like.

options = dict(marker='o', linewidth=0, alpha=0.3, label='') df['% responding right'].plot(color='C0', **options) df['% responding wrong'].plot(color='C1', **options) right = make_lowess(df['% responding right']) right.plot(label='Right') wrong = make_lowess(df['% responding wrong']) wrong.plot(label='Wrong') plt.legend();
Image in a Jupyter notebook