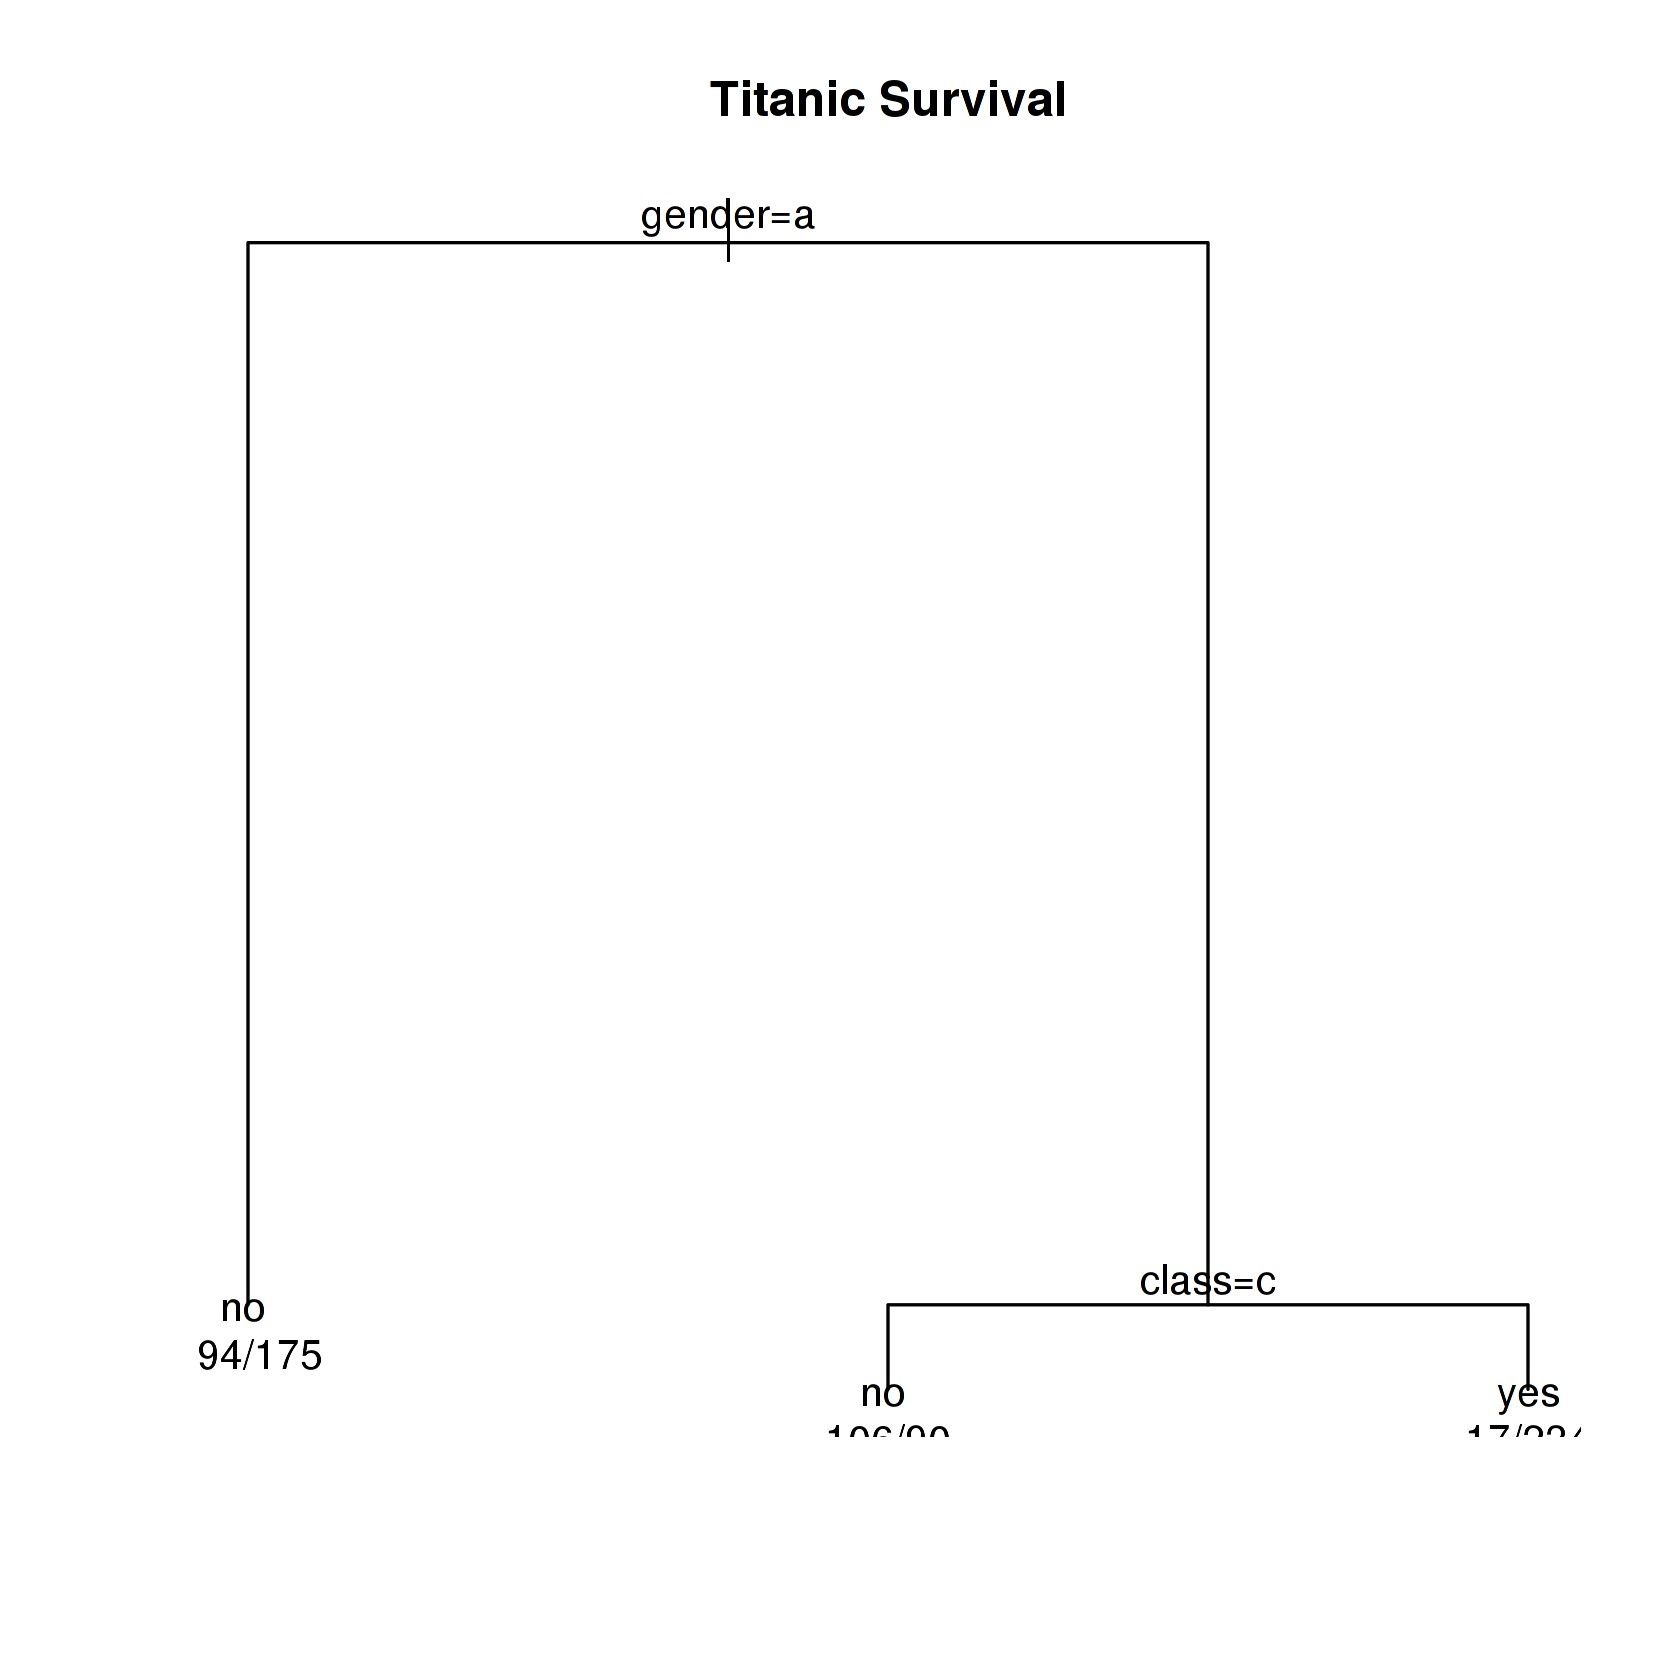
Call:
randomForest(formula = as.factor(survived) ~ ., data = titanic, importance = TRUE, ntree = 2000)
Type of random forest: classification
Number of trees: 2000
No. of variables tried at each split: 1
OOB estimate of error rate: 21.66%
Confusion matrix:
no yes class.error
no 791 26 0.03182375
yes 259 240 0.51903808
| no | yes | MeanDecreaseAccuracy | MeanDecreaseGini | |
|---|---|---|---|---|
| class | 48.50761 | 46.09300 | 49.88664 | 42.708540 |
| age | 28.41795 | 25.60417 | 33.45813 | 6.814097 |
| gender | 61.48417 | 69.81685 | 67.37503 | 108.850507 |
